 ARIOS INC.


|
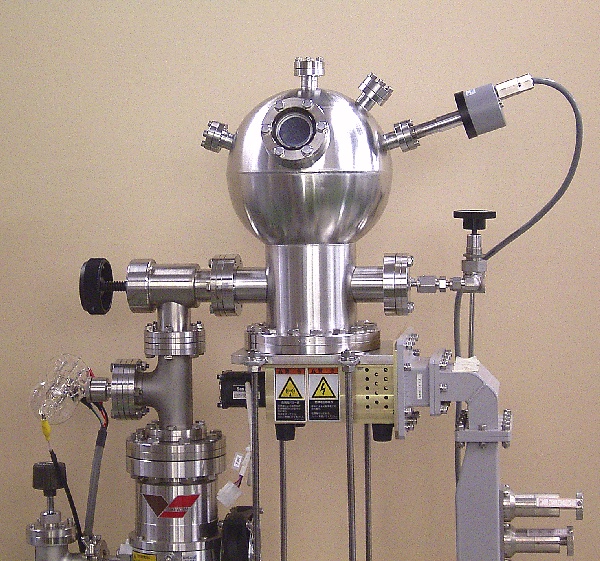
The multipoint Langmuir probe systemIntroduction
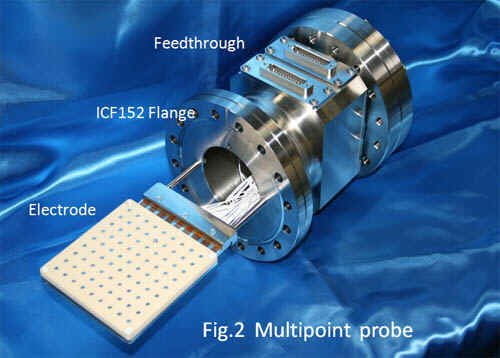
Fig.1 is system diagram. multipoint probe photo shows Fig.2. This
multipoint probe has 9x9=81 point probe on insulator board that the size is 100x100mm.
These electrodes are connected to source measure unit (SMU) through vacuum feed through
terminal and connection box. Connection box are selected each point probe and connected to
SMU. Connection box is controlled by Personal Computer (PC).
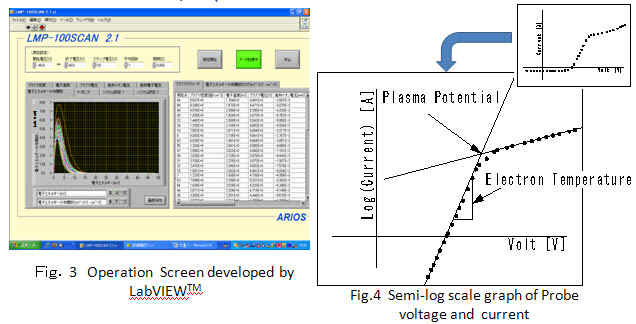
A LabVIEW computer program was developed to run the data acquisition and the data analysis. Fig.3 shows operation screen.
There is two methods to determine the point of plasma potential from the
voltage-current (V-I) data. One is differential calculus of the V-I curve. The maximum of
the differential value is the point of plasma potential. This method outputs an accurate
value, but is vulnerable to a noise. Other method is tangent line method. Exponential
curve changes to straight line in semi-logarithmic V-I graph. The intersection of
saturation region and exponential region is the point of plasma potential. As for this
method, the answer includes error, but is provided surely. Tangent line method was adopted
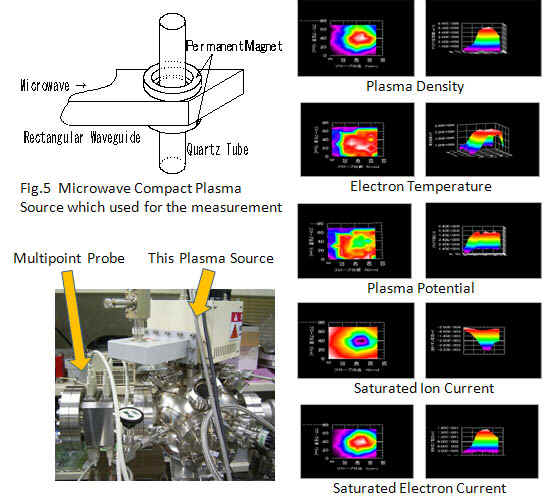
in this system. The tangent line was decided by using of Hough transform methods. These show the sample of results that was measured at the exit of remote plasma from microwave compact plasma source. Fig.5 shows the schematic of this plasma source. Inner diameter of aperture is 35mm. Fig.6 shows various plasma parameter at 200mm distance. In the plasma density, the highest center and a state of the diffusion can be observed. In all parameters, distribution can be recognized visually.
Fig.7 shows EEDF. A difference of the electronic energy distribution can be observed.
Homo-epitaxial CVD Diamond
Experimental conditions
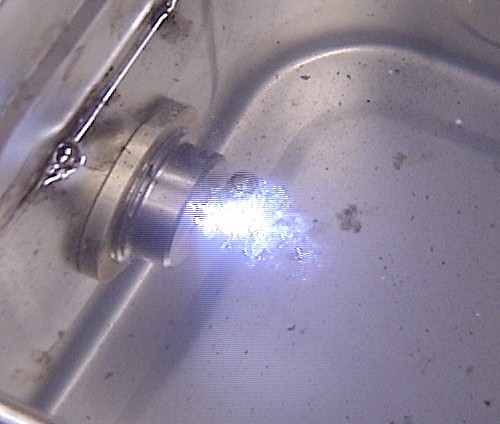
Plasma in water generated by microwave
|
Farther infomation, Please send E-mail : mailto:info@arios.co.jp
|